Tag Archives: The Tax Foundation

Tax Freedom Day April 17

“Tax Freedom Day® 2012 arrives on April 17 this year, four days later than last year due to higher federal income and corporate tax collections. That means Americans will work 107 days into the year, from January 1 to April 17, to earn enough money to pay this year’s combined 29.2% federal, state, and local tax bill,” according to The Tax Foundation.

“If the federal government raised taxes enough to close the budget deficit—an additional $1.014 trillion—Tax Freedom Day would come on May 14 instead of April 17. That’s an additional 27 days of government spending paid for by borrowing. This year’s federal budget deficit remains high, though it has declined slightly over the past two years.”

“As the economic recovery continues, the growth in individual incomes and corporate profits will increase tax revenues and push Tax Freedom Day ever later in the year. The latest ever Tax Freedom Day was May 1, 2000—meaning Americans paid 33.0% of their total income in taxes. A century earlier, in 1900, Americans paid only 5.9% of their income in taxes, meaning Tax Freedom Day came on January 22.”

The above figures are the national average. Tax Freedom Day arrives on different dates for each state. Tax Freedom Day came April 12 for Ohio taxpayers. Tennessee enjoyed the earliest day, which was on March 31st but Connecticut will still be paying Uncle Sam until the 1st of May.

Last year, IRS processed 143 million tax returns, but only 58 million (59%) paid any taxes. They paid a total of $945 billion in federal income taxes. All of the tax filing consumes an estimated 7 billion hours in order to comply with the 3.8 million word tax code. This alone demonstrates the need for serious tax reform some similar to the simplified fair tax proposal.

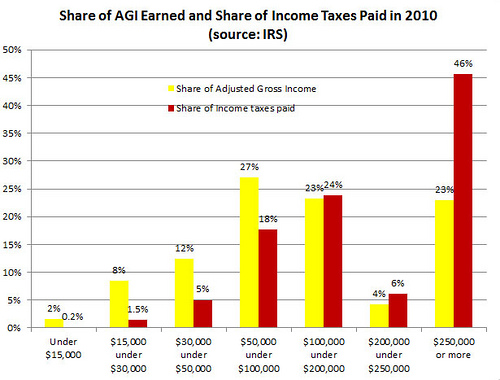
Below is a chart indicating the share of income taxes paid by adjusted gross income levels. As you will see, the Tax Foundation’s chart shows upper income earners already paying most of the federal income taxes. The Obamaites appear to wrong about the wealthy taxpayers not paying enough taxes.

Ohio, 46th Worst Business Tax Climate : The Tax Foundation’s 2011 State Index

The Tax Foundation released the newest edition of the State Business Tax Climate Index, which ranks from 1 (best) to 50 (worst) the tax systems of the 50 states. South Dakota’s tax system is most welcoming to economic activity while New York’s tax code ranks 50th as the least hospitable. Ohio almost caught up with New York being ranked as 46th least tax friendly state.

The goal of the index is to focus lawmakers’ attention on the importance of good tax fundamentals: enacting low tax rates and granting as few deductions, exemptions and credits as possible. This “broad base, low rate” approach is the antithesis of most efforts by state economic development departments who specialize in designing “packages” of short-term tax abatements, exemptions, and other give-aways for prospective employers who have announced that they would consider relocating. Those packages routinely include such large state and local exemptions that resident businesses must pay higher taxes to make up for the lost revenue. As a result, businesses often move to other regions or states to remain competitive.

States with the best tax systems will be the most competitive in attracting new businesses and most effective at generating economic and employment growth. As we will see, Ohio need more than government generated jobs. Ohio needs a serious tax code revision.

The index ranked states based on five component tax indexes:

• The Corporate Tax Index
• The Individual Income Tax Index
• The Sales Tax Index
• The Unemployment Tax Index
• The Property Tax Index

The Corporate Tax Index assesses both corporate income taxes and/or gross receipts taxes. Ohio taxes business on the latter gross receipts.

The Individual Income Tax Index measures the effect on small businesses and entrepreneurs, on labor costs, and, depending on the type of business, on consumer spending. One reason Ohio ranks among the worst states is it arranges the top income brackets in the middle range of income. Ohio is among the states with the highest marriage tax penalties. Ohio’s local income tax rates also are the third highest in the nation.

Sales Tax Index measures the rates and effects of taxes both on business. A form of double taxation exists when a business pays sales tax that increases the cost of goods and services and when the consumer pays sales tax on the same goods or services. The two components of the index consist of the tax rate and tax base, which is the range and types of goods and services taxed.

The Unemployment Insurance Tax Index measures the effects state and federal rate structures and related policies and how potentially damaging to business they may be. Ohio was ranked as among the states with the best unemployment insurance structures.

Finally, the Property Tax Index is comprised of taxes levied on the wealth of individuals and businesses. These include taxes on real and personal property, net worth, and the transfer of assets. Some studies property taxes are a significant factor of business location decisions.

So how did Ohio rank on each of these indexes?

Tax Indexes 2011 2010 2009 2008 2007 2006
Corporate Tax 39 38 33 33 39 47
Income Tax 44 46 47 47 49 50
Sales Tax 35 37 39 39 38 43
Unemployment Tax 11 10 15 15 11 48
Property Tax 39 38 33 33 39 13
Overall Rank 46 47 48 48 47 47


Anyone for lower sales, income and property taxes? If you are, you must also be for more efficient government operations and fewer unnecessary government programs.

State (& Local) Tax Revenue Decline : A Perspective

By Daniel Downs

A new state revenue report by the Tax Foundation came our yesterday. The report entitled “State Revenue Changes from 2008 to 2009” reveals Ohio tax revenues declined 8.7 percent the period assessed. Ohio ranked 28 which amounted to 2/10 of a percent below the national average of 8.9 percent.

Alaska suffered the highest percent of revenue decline at 51.9 percent. The next highest was Arizona at 19.7 percent, followed by California at 15 percent, and then Idaho at 14.1 percent. The state with the highest percent of tax revenue gain was Wyoming at 13.9 percent, followed by North Dakota at 4.3 percent, and then by Oregon at 1.9 percent.

The report also broke out the tax revenue losses by tax category i.e., property tax, individual income tax, corporate income tax, general sales tax, and selective other taxes. Ohio didn’t report property taxes collected. However, the report did show that the greatest loss of tax revenue in Ohio originated from corporate income declines. The percent of corporate income tax revenue decline was 36.6 percent, whereas individual income tax revenue decline only 16.8 percent. Sales tax revenue declined a mere 7.1 percent.

The high level of corporate income tax loss is due to the closing of both large and small businesses throughout the Ohio as a result of the great recession. Both greedy investors and power-mongering politicians must be thanked for the losses.

As mentioned in previous posts, the loss of tax revenues by Ohio government came after consistent increases in tax revenue and increased spending. The report brings this out very clearly in its historical statistics. When those national statistics are added up, the total percent of tax revenue increase was 19.7 percent, that is the total average increase for the nation from 2000 through 2007. The total decline from 2008 through 2009 was 9.2 percent.

The last paragraph of the report puts these above figures in proper perspective:

“Although state tax revenue decreased significantly during fiscal year 2009, the decrease is almost exactly matched by earlier years of major increases. Over the last decade, adjusting for inflation, state tax revenues have increased by 6.1 percent. When controlling for population, tax revenues are down about one percent.”

Like Xenia, many local communities are getting less money from the State because of the decline in tax revenues collected. As the report indicates, the real loss is only about 1 percent. That is why during times such as these taxpayers should not allow government officials to raise taxes to cover short-term fiscal problems is wrong. it is simply wrong to fix short-term financial problems with permanent taxes. The right thing is to assure that public officials practice fiscal and budgetary restraint. If necessary, they can always dip into the million dollar plus reserve fund until the economy actually recovers.

Ohio Revenue Commissioner Slams Tax Foundation for Criticizing State’s Gross Receipts Tax

By Joseph Henchman

Ohio Revenue Commissioner Richard A. Levin slams the Tax Foundation for criticizing the terrible Commercial Activities Tax (CAT), a gross receipts tax that Levin himself helped usher in. Economists of all stripes agree that gross receipts taxes, while deceptively simple and low, actually introduce severe economic distortions and result in significantly different effective tax rates on similar or even identical products.

But Levin also says the Tax Foundation is wrong to criticize Ohio for its franchise and intangibles taxes, both of which he says don’t exist. (He even equates them to unicorns and pixie dust). The franchise tax (with a rate of 4 mills, distinct from the corporate income tax) has indeed been repealed, but only very recently (January 2010). Our State Business Tax Climate Index, which comes out each fall, will reflect this repeal in our 2011 report.

As for the intangibles tax, it is alive and well. Levin should know, as he was the named defendant in a case involving the tax that went all the way to the Ohio Supreme Court in 2008, UBS Financial Services v. Levin. For a tax that Levin says was repealed in 1985, it seems to still be imposing significant costs on companies doing business in intangibles. I hope Levin lets UBS know that they don’t need to pay that tax after all.

What really matters, though, is that state officials have long engaged in a propaganda effort to claim that Ohio’s tax system is low and attractive despite significant evidence to the contrary. (Levin notes that he “sense[s] genuine excitement…about our new state tax system.”) In reality, Ohio taxpayers are burdened with the 7th highest state-local tax burden in the United States. Our review of state tax structures finds theirs to be the 47th least business-friendly in the United States. Few impartial experts think that Ohio will see much in the way of job growth or capital formation without serious reform.

And it needs to be reform that leads to lower tax burdens and less economic distortions, not the “reforms” of the CAT that go in the opposite direction.

Joseph Henchman is Tax Counsel and Director of State Projects of The Tax Foundation

America Celebrates Tax Freedom Day®

Every year the Tax Foundation tells us when to rejoice over our collective freedom from paying for the national debt. If you think it occurs before Tax D-Day, April 15, you are sadly mistaken. In 2008, Tax Freedom began on April 23. As depicted by the chart below, it has not been come on or before the tax filing deadline since 1982.

As reported in the last Tax Freedom Day report:

In 2008, Americans will work 74 days to afford their federal taxes and 39 more days to pay state and local taxes. Meanwhile, buying food requires 35 days of work, clothing 13 days, and housing 60 days. Other major categories are health and medical care (50 days), transportation (29 days), and recreation (21 days).

Five major categories of tax dominate the tax burden. Individual income taxes, both federal and state, require 42 days’ work. Payroll taxes take another 28 days’ work. Sales and excise taxes, mostly state and local, take 16 days to pay off. Corporate income taxes take 13 days, and property taxes take 12.

Interestingly, tax freedom came on January 19 in 1900. Taxes as the percentage of average income was 5.9 percent. The new date has already stated above, but the percent of income going to government was 30.8 percent, down from 31.7 the year before.

States exceeding the average, April 23, are Connecticut (May 8), New Jersey (May 7), New York (May 5), Washington D.C. (May 3), California (April 30), Washington (April 29), Maryland and Massachusetts (April 28), Minnesota (April 27), Florida, Hawaii and Nevada (April 26), Virginia (April 25), Rhode Island and Wisconsin (April 24). Notice, most of these state are liberal leaning. The only state with tax freedom day in March is Alaska. Ohio’s is April 17.

If fat Uncle “Guido” Sam succeeds in stimulating the national debt to over $15 trillion, the day on which the income of American is free of debt by taxation will likely arrive sometime in May of 2010.

The arrival of Tax Freedom Day 2009 is still in question.